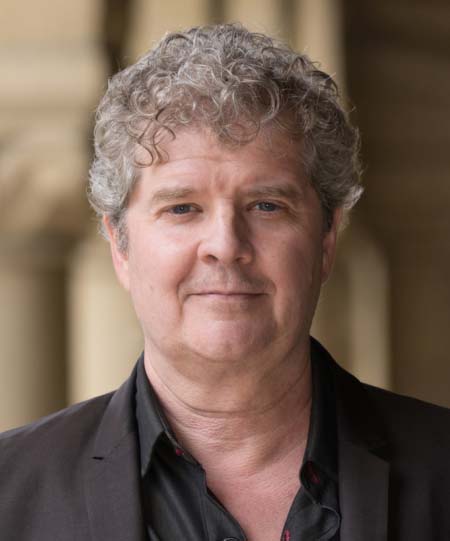
 This month, NCEE staff spoke with Dr. Sean Reardon, a world-renowned scholar on inequality in education. In addition to being the endowed Professor of Poverty and Inequality in Education at Stanford University, Dr. Reardon is the Project Director of The Educational Opportunity Project (EOP) which houses the Stanford Education Data Archive (SEDA). This new publicly available database provides 10 years of math and reading and language arts test scores for nearly 430 million third through eighth graders across the United States. The website provides an interactive tool that allows users to look at measures of academic achievement and trends at the school, district, county, and state level. Data can be filtered by place, subgroup, and school type and multiple locations can be compared. The online dataset offers education researchers, practitioners, and policymakers a rich new way of looking at data as they draw inferences about educational opportunity.
We spoke to Dr. Reardon to learn more about the insights SEDA can offer states, districts, and schools, and how it could help in the work to fight inequality in education. His remarks touched on how to develop more sophisticated measures of poverty and inequality; the opportunities for state, district, and school leaders to learn from one another; the need for policymakers to take a broader view of inequalities in education; and the impact of the coronavirus pandemic on our efforts to measure student learning.
NCEE: What were the goals for creating the SEDA project?
Dr. Sean Reardon: Originally, we were interested in measuring achievement gaps in a way that was comparable across states and districts. Although we’ve used standardized tests for more than 15 years, the tests given in each state are different. They differ from grade to grade, they change over time, and the scores aren’t reported comparably.
To deal with this, I and my collaborators—Andrew Ho (Harvard University), Erin Fahle (St. John’s University), and Ben Shear (University of Colorado Boulder)—developed methods to convert scores to a common scale, so we could compare performance across districts and states, across grade levels, across time, and across student groups. We started with modest goals, but we then realized we could do more with the data. It turned into a much bigger enterprise, and I think a much more useful one than we had first envisioned.
NCEE: The interactive database you have developed for practitioners and policymakers allows them to look at student learning rates, and compare them across districts and schools, in ways that were previously not possible. Can you explain that concept?
Dr. Sean Reardon: Learning rates are, in many ways, more interesting and more important than average test scores. Because of ESSA testing requirements, students are in third grade when they first appear in data sets. Some have higher scores and some have lower scores. But the schools and districts that had the highest scores in third grade aren’t necessarily the ones with the highest scores in eighth grade. The change in average test scores from third to eighth grade represents the average rate at which students have learned new material in math and English language arts over those six grades. This is the learning rate. An analogy would be to say let’s not measure how tall students are in eighth grade, let’s measure how much they grew while in school.
If students enter schools with low literacy or math skills, but learn a lot from kindergarten to eighth grade, you want to give the school system credit for what opportunities the schools provided, not penalize it for the lack of opportunities students had to learn prior to coming into school. Likewise, if students came to kindergarten with high math and reading skills and didn’t learn a whole lot more by eighth grade but still have pretty high scores only because they started so high, you wouldn’t say this is a great school system. You would say these students had lots of opportunities to learn outside of school.
The learning rate is our best indicator of where to learn from promising practices and where to change things. The difference in the rate between student groups is a reliable measure of how equitably the school system is providing opportunities. It doesn’t confound those contributions with the differences in kinds of opportunities students had before third grade, many of which are due to outside-of-school experiences before they even got to kindergarten.
NCEE: We’re interested in the measure of socioeconomic status you use. How does your measure differ from the free and reduced priced lunch (FRPL) measure most policymakers and practitioners use?
Dr. Sean Reardon: The FRPL measure is fairly coarse, and not as useful as it used to be. The introduction of the community eligibility provision allowed schools to give all students free lunch if at least a minimum number of students at that school are eligible. While we support this policy, it has clouded the reporting of free and reduced lunch as an indication of student poverty. But even before that, FRPL just told us how many students have family incomes below 185 percent of the poverty line. It never told us how many students are in deep poverty. Similarly, FRPL never helped us to understand where students were highly affluent.
Instead, we use the American Community Survey (ACS), the annual U.S. Census Bureau survey, to look at the families with children who live within a school districts’ boundaries. From ACS, we get measures of the median income of those families, the percent of parents with a bachelor’s degree, the poverty rate, the unemployment rate, the SNAP eligibility rate, and the percentage of female-headed households. We combine those six measures into a single index that is much more nuanced than FRPL in the sense that it differentiates between moderately affluent and very affluent districts and between very poor and moderately poor districts much better. It captures some of the family socioeconomic resources that are available to students.
One of the things we do on our website is show the test scores or the learning rates in relation to our measure of socioeconomic status to help users put their scores or the patterns of data in context. A lot of the very high-performing schools and districts are in very affluent communities, and a disproportionate number of low-performing schools and districts are in very poor communities. It’s clear that some of the variation in student performance is not due to the schools; some is due to the opportunities available to students outside of school.
NCEE: You’ve argued that we don’t know how to create educational opportunity at scale under conditions of concentrated poverty. How can policymakers address this problem?
Dr. Sean Reardon: If you think of average test scores as a summative measure of all the opportunities students have had up until they take these tests, there’s no poor or really poor community in the country where students at scale are scoring on grade level, and certainly not above level. There are some great schools where students learn a lot, at least from third to eighth grade. But average scores for schools in these communities are not that high, because the students come into third grade with very low scores.
That means there really are no poor or very poor communities where our society as a whole is providing high levels of educational opportunities. I think the solution is not to try to figure out how to do that under conditions of concentrated poverty; instead, we need to figure out how to get rid of concentrated poverty.
There’s no silver bullet: income support programs, good healthcare, and housing programs are all necessary to change how the picture looks. Asking schools to undo the damage that a highly unequal and highly segregated society has done is too much. It’s not to say that schools can’t be part of the solution, but to think that schools alone will salvage the American dream from the conditions of a highly unequal, segregated society is unrealistic.
We have to address structural inequality, racial inequality, economic inequality, and residential segregation so that children come to kindergarten on more even footing. Education systems, at best, don’t really start to interact with children until age three or four and they don’t do so systematically until age five. The pediatric medical system has more potential to interact with children and their families early on than do schools. You have to have all of those systems focused on equity and opportunity, and then we can make real progress.
NCEE: We know that these structural inequalities will be exacerbated by what has happened over the past year. How will you handle the data that is missing as a result of the pandemic?
Dr. Sean Reardon: All education data systems—state, district, and research systems—are going to be impacted by this because we don’t have good data on what’s been happening to students. We don’t know which schools have been operating remotely or in a hybrid model or in person for when and for how long. We don’t know a lot about the experiences students had during COVID except that they were largely nothing like anything we recognize as regular school.
As time goes on, we’ll have more ways of assessing the impact on overall inequality nationwide. We may in a few years be able to say something about the disproportionate impact or the general impact of COVID, school closures, remote learning, hybrid learning, and the general disaster that’s been going on. The NAEP assessments will be useful. There was a 2019 NAEP, and there will be a 2022 NAEP: those should provide good information.
And if regular standardized testing resumes in 2022, then we’ll also be able to use those scores to see where children fell behind as a result of the pandemic. That could help us to learn what happened in individual schools and districts. We need to know that to know where to target resources and what kinds of resources are needed. We need to figure out where students really suffered and need extra supports to catch up. I think this information will be patterned by class and by race, but it also varies a lot from student to student. For some, it’s really hard to not be in the collective, social environment of the classroom or school. For others, it may have been somewhat beneficial not to be distracted by other people.
NCEE: Where would you like to see the SEDA project go long term?
Dr. Sean Reardon: We want to start working with states or big districts that have more detailed data on students’ experiences and think about where the opportunity structure breaks down. What is happening either prior to school or in school that leads to unequal opportunities and unequal outcomes? Are students not getting equal access to the same skilled teaching? Are they not getting access to the same kind of curriculum? Are they in highly segregated settings? Do they have different socioemotional experiences? Are there school climate issues? What are the features of the opportunity structure that lead to these differences in outcomes? Once we know that, we can start to say where to intervene in order to improve equity of opportunity.
Test score data shows us where the problem is and when it occurs. That’s good, but it doesn’t tell us what exactly is happening that causes it. Linking the data we have to other types of data can help diagnose causes and point to remedies.
The National Academy of Sciences put out a report two years ago on monitoring educational equity. It called for education systems to collect the data and construct measures of educational equity throughout the K-12 system to help systems figure out where opportunities were being provided more or less equitably. There seems to be some momentum for states to do that and build systems like that. If we had a national consensus about a set of equity indicators that would be useful to have, you can imagine states constructing those for each of their schools or their districts, in the same way they put out report cards on every school. Having that kind of data will help us diagnose problems and better target resources to improve the equality of educational opportunity in America.